Microsoft Excel is widespread and probably best Spreadsheet application available today in the market.
It is a go-to tool for any kind of data analysis, and when it comes to financial data, it is must know the mechanism.
While most of us know about excel (even more if you are the advanced user) but very few know about the term “Modern Excel.”
My Excel Journey started around 13 year ago while I was working as Article Clerk, and then my Excel skills have grown it subsequently year by year and as the situation demanded (mainly Formulas and VBA).
But there was a huge revelation, and I was introduced to the term “Modern Excel”. Modern Excel is nothing but new sets of Data Transformation tools added way back in 2007
There are three main components of Modern Excel architecture: Power Query (Get and Transform), DAX, and Power Bi.
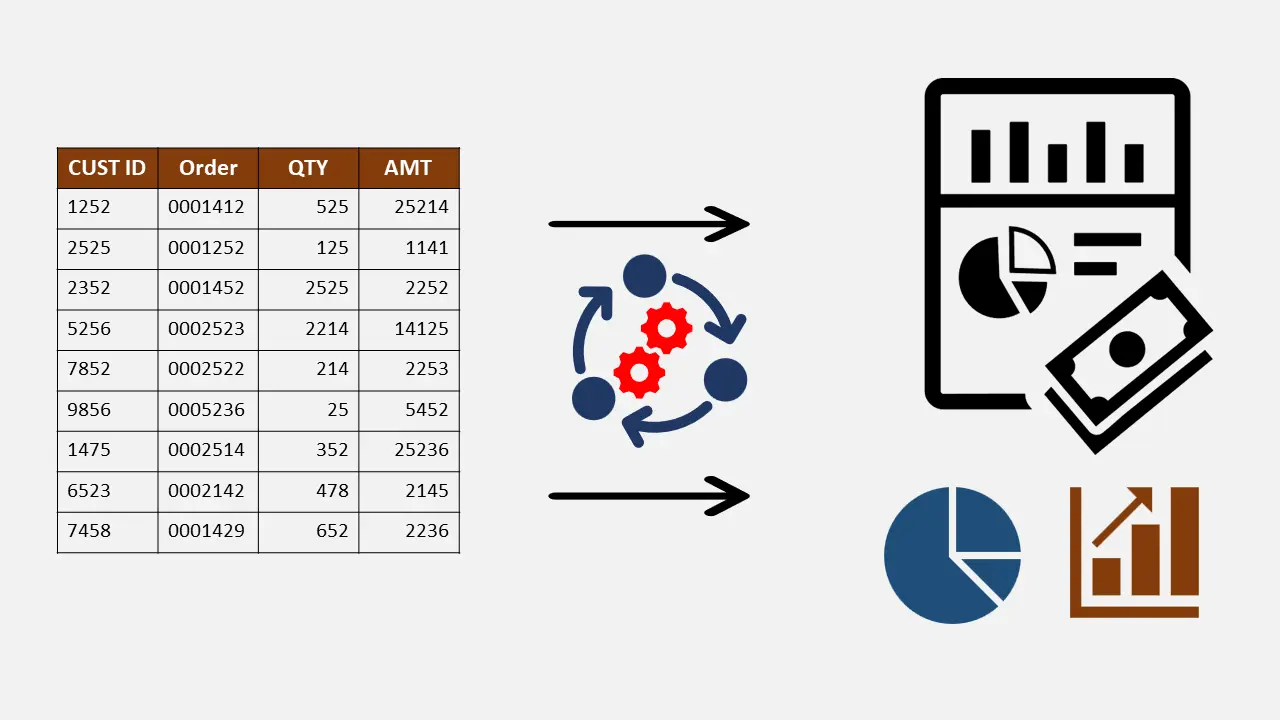
For me personally, Power Query has been a magical revelation how I used to see Spreadsheets and Data as a whole. Now I can connect to a rich set of external data sources and even local data in a spreadsheet and collect, combine, and transform the data by using a simple user interface.

Once the data is well prepared, I can load it into a report in Excel and Power BI or stored as a table in other products that incorporate it.
Then, whenever the data is updated, I can refresh the reports and enjoy the automated transformation of my data.
I have always believed in automation while working with spreadsheets either by using complex formulas or VBA.
Believe me, learning Power Query is very easy compared to mastering VBA (I love VBA but let’s face it, it’s not easy to master programming concepts if you don’t have any previous programming background).
I have replaced all my VBA codes which I had developed after many trial and error for exact same workflow with Power Query.
How it actually works? – As I prepare my data using Power Query Editor, the main interface of Power Query, the tool records a sequence of transformation instructions, enabling me to repeat the data preparation sequence in the future.
Advanced Excel users often compare it to macro recording, but it is much simpler than that.
When I am finished with the transformation steps, I can load the prepared data to a report.
From that point on, any time I refresh the report, the sequence of transformation steps runs, saving me many hours and days of repetitive manual data preparation work.
Power Query is truly simple to use. It shares a unified user experience—no matter what data source you import the data from or which format you have.
Power Query enables you to achieve complex data preparation scenarios via a sequence of small steps that are editable and easy to follow.
How do I get Power query in Excel?
You will require Office/Excel 2010 or later version to use Power Query, it is available as Free Addin for Excel 2010 (32bit only) and Excel 2013. While for Excel 2016 (or Office365), it is part of the Excel’s Data Ribbon and it’s called “Get & Transform.”
You can import data from many different data sources into Power Query for reshaping data into a proper tabular structure.
Some of the references are Excel workbooks, CSV files, Text Files, SAP Data Base, Oracle Server Database, SQL Server, Web, Facebook, YouTube, Salesforce, Access and many more.
You can Combine all these sources via power query and create a single structural dataset which can be further used in Data Analysis and reports.
Also, you will just have to do this setup process once, next time when there is an update in source data, you just have to refresh the steps within Power query and you are done, your new sets of data are added to your reports, is that awesome?
Being an Accountant, the only additional skill you would need to enhance your reporting with Power query (and completely automate it) is Pivot tables. I was able to create complex MIS reporting system which has more than three cost centres and various overheads section and many other complexities with just the help of one Formula which is rarely used “GETPIVOTDATA”
I have created a completely dynamic Excel Dashboard without using any formula, you can add more data to the source file, and it refreshes automatically, all of it done using Power Query (truly amazing).
In conclusion, fellow accountants to give it a try to this excellent and powerful data transformation tool today and share your stories with me.


One Response
What Power Query course do you recommend? I find that I learn more by practical examples such as videos rather than reading a book. Do you recommend any specific courses on Udemy for Power Query specifically?
I am on a journey to becoming a data analyst and bought your Compare Workbook course, I really enjoyed the content.
One thing I would note, I would classify each document being reviewed in the Udemy lectures under a matching name in the Zip content-resources folder to make it easier to follow along.
Thank you,
Marco